

COMPASS MS AI Software
COMPASS MS AI Software |
|
| description: | COMPASS MS AI Software designs software for analysis of large biomolecular datasets, particularly those derived from mass spectrometry. With technological leaps in mass-spec instrumentation, Magellan’s software provides the computational tools to rapidly |
|---|---|
Basic Introduction:
COMPASS MS AI Softwaredesigns software for analysis of large biomolecular datasets, particularly those derived from mass spectrometry. With technological leaps in mass-spec instrumentation, Magellan’s software provides the computational tools to rapidly analyze massive mass-spec data flows.
Magellan’s analytics can consider the entire data output of the most advanced mass spec instruments. It allows comparative proteomics, lipidomics, and/or metabolomics experiments with thousands of samples. It will facilitate seamless integration of mass-spec datasets with sequencing-based datasets. What took months or years of data analysis can now be accomplished in days, even with limited prior mass spec experience.
Rapid, large-scale analysis of mass spec data makes different experimental approaches possible and increases the chances for novel discovery. Identify every mass spec features connected to a biological question first, then characterize their molecular identity. Analyze datasets large enough to detect relevant differences connected to the most subtle biology. Let Magellan’s COMPASS software transform your research.
ProductAdvantages:
Data safety. Dataprocess in your own PC.
Solving Data Overload.
Highly Stable Biomarker Profiles.
Goes beyond MS.
Application:
Proteomics, Lipidomics, and Metabolomics Experiments MS data analysis.
Technical Specification
After launch, users will be able to upload mass spec (MZML) files to be analyzed by COMPASS. Users will also need to upload a sample information dataset (CSV) file that contains any number of sample parameters. Users can then create one or more workbooks to analyze the mass spec data in relation to any or all of the parameters in their sample information dataset.
If users have data on the molecular identity of specific features within your MZML files, they can upload this reference information to create a dictionary. In subsequent analysis, COMPASS software will indicate when any high information biomarkers are likely annotated molecules from users' dictionary.
Once users have uploaded their mass spec data, a sample information database, and a reference map of feature identities, users are now ready to rapidly explore and visualize their data. A video demonstration of how our tools can be deployed to analyze a series of mass spec files.
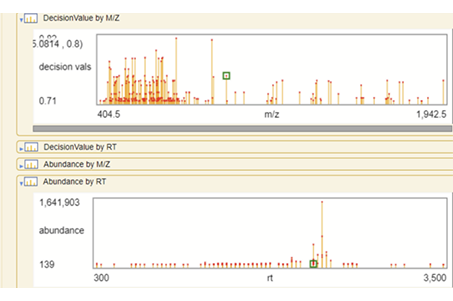
By selecting some parameter from their sample information database as an ‘outcome,’ users can then immediately rank millions of datapoints by how well they correlate with that outcome (their ‘decision value’) If our standard resolution setting is used to extract the MZML files, this step is accomplished in minutes. After selecting high information datapoints, m/z, chromatographic retention time, abundance, and decision value are visualized. Users can zoom in to regions of interest or select individual datapoints to see how their expression varies across the sample set.

 Scan QR Code & Subscribe